전단력 및 굽힘 모멘트 다이어그램
Shear force and bending moment diagrams

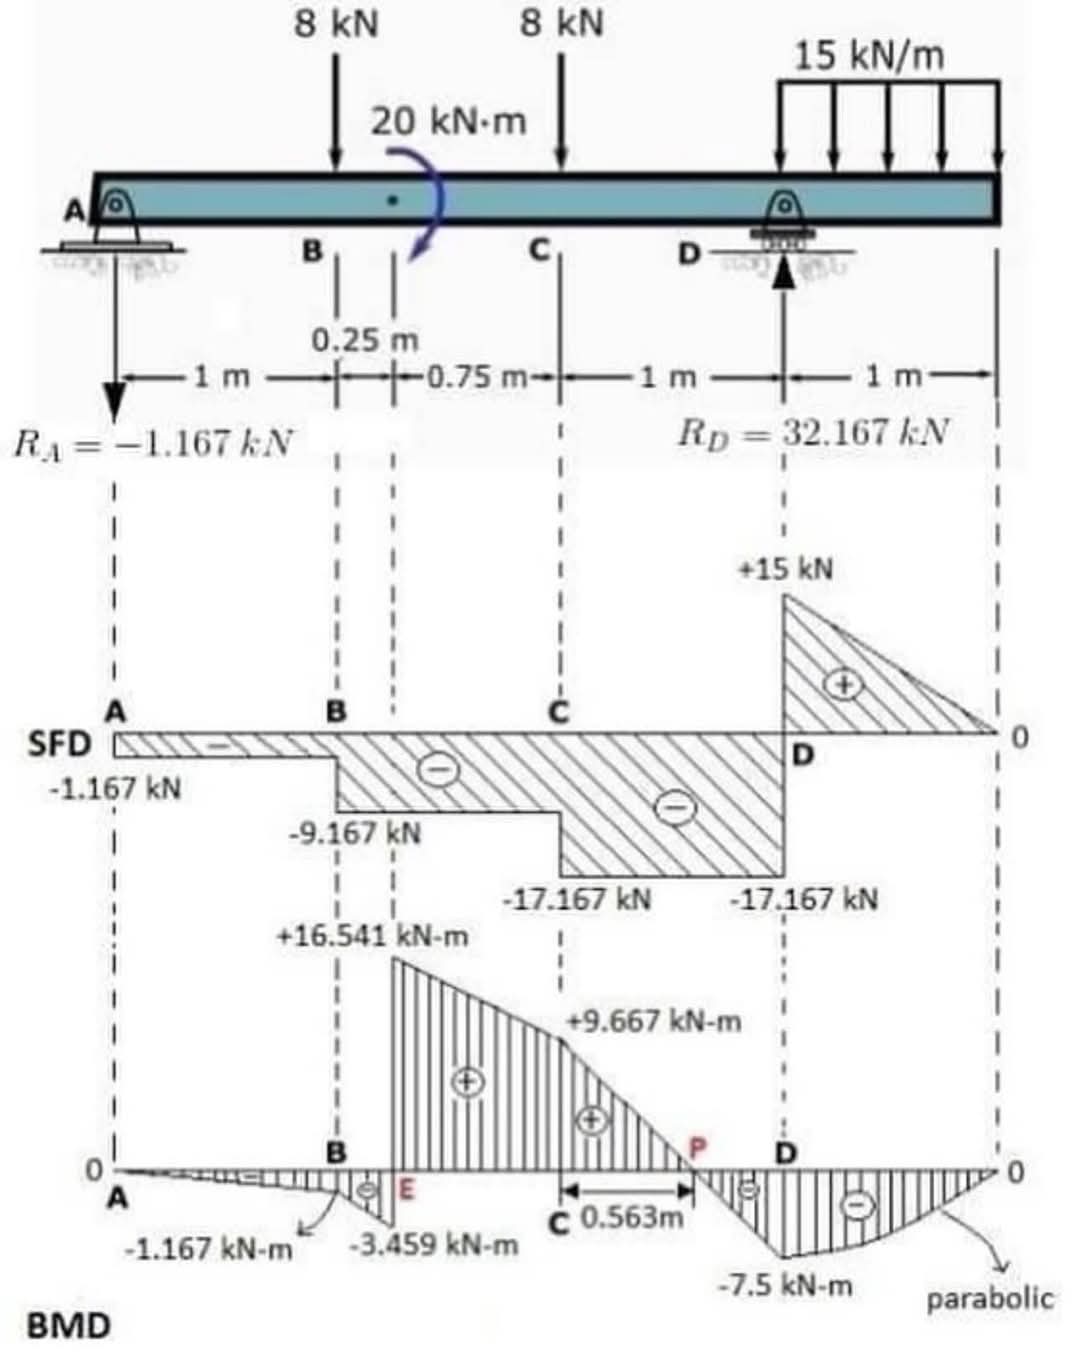
이 그림은 보(beam) 구조물에 대한 **하중(Loads), 반력(Reactions), 전단력선도(Shear Force Diagram, SFD), 그리고 굽힘모멘트선도(Bending Moment Diagram, BMD)**를 나타냅니다. 단위는 kN과 kN·m으로, 킬로뉴턴과 킬로뉴턴미터를 의미합니다. 각 부분을 자세히 살펴보겠습니다.
1. 보 구조물 (Beam Structure):
- 길이: 보의 전체 길이는 4.25m입니다.
- 지지 조건: 보는 양쪽 끝 A와 D에서 고정 지지(fixed support)되어 있습니다. 고정 지지는 회전과 수직 이동을 모두 방지합니다.
- 하중: 보에는 다음과 같은 하중이 작용합니다.
- 점하중(Point Load): B점에 8 kN, C점에 8 kN.
- 모멘트(Moment): C점에 20 kN·m (시계방향).
- 분포하중(Distributed Load): D 구간에 15 kN/m의 등분포하중.
2. 반력 (Reactions):
- R_A: A 지점의 수직 반력은 -1.167 kN입니다. 음수 부호는 반력의 방향이 그림에서 아래쪽 방향임을 나타냅니다.
- R_D: D 지점의 수직 반력은 32.167 kN입니다. 양수 부호는 반력의 방향이 그림에서 위쪽 방향임을 나타냅니다.
3. 전단력선도 (SFD):
SFD는 보의 각 지점에서의 전단력을 나타냅니다.
- A: -1.167 kN (왼쪽 지점에서 시작하는 하중의 영향)
- B: -9.167 kN (B점의 점하중 영향)
- C: -17.167 kN (C점의 점하중 및 모멘트 영향)
- D: 0 kN (D점에서 모든 하중의 영향이 상쇄)
SFD는 하중의 변화에 따라 선형적으로 변화합니다. 등분포 하중 구간에서는 선형적으로 변하나 그 기울기는 일정합니다.
4. 굽힘모멘트선도 (BMD):
BMD는 보의 각 지점에서의 굽힘모멘트를 나타냅니다.
- A: -1.167 kN·m
- B: -3.459 kN·m
- C: 0.563 kN·m
- D: -7.5 kN·m
BMD는 전단력의 적분으로 구해지며, 점하중에서는 갑작스러운 변화를 보이고, 분포하중에서는 2차 곡선(parabolic) 형태를 보입니다. C 점의 모멘트 하중으로 인해 BMD가 급격히 변화하는 것을 볼 수 있습니다.
요약:
이 그림은 정적 구조해석(Statics)을 통해 보의 하중, 반력, 전단력, 그리고 굽힘모멘트를 계산하고 시각적으로 나타낸 것입니다. SFD와 BMD는 보의 내부 힘을 이해하는 데 필수적이며, 보의 설계 및 안전성 평가에 사용됩니다. 특히 BMD는 보의 강도 설계에 중요한 역할을 합니다. 음의 값은 압축, 양의 값은 인장을 나타냅니다.
추가 설명:
- 그림에 표시된 값들은 계산 결과이며, 계산 과정은 생략되어 있습니다.
- 이 그림은 단순화된 모델이며, 실제 보 구조물의 복잡한 요소들은 고려되지 않았을 수 있습니다. (재료의 비선형 거동 등)
Shear force and bending moment diagrams
This diagram illustrates the loads, reactions, shear force diagram (SFD), and bending moment diagram (BMD) for a simply supported beam. The units are in kN (kilonewtons) and kN·m (kilonewton-meters). Let's break down each component:
1. Beam Structure:
- Length: The total length of the beam is 4.25 meters.
- Support Conditions: The beam is simply supported at points A and D. Simple supports allow for vertical movement but prevent rotation at those points.
- Loads: The beam is subjected to the following loads:
- Point Loads: 8 kN at point B and 8 kN at point C.
- Moment: 20 kN·m (clockwise) applied at point C.
- Uniformly Distributed Load (UDL): A 15 kN/m UDL is applied over the section from C to D.
2. Reactions:
- RA: The vertical reaction at point A is -1.167 kN. The negative sign indicates the reaction force acts downwards.
- RD: The vertical reaction at point D is 32.167 kN. The positive sign indicates the reaction force acts upwards.
3. Shear Force Diagram (SFD):
The SFD shows the shear force at each point along the beam.
- A: -1.167 kN (influenced by the left-hand reaction)
- B: -9.167 kN (influenced by the point load at B)
- C: -17.167 kN (influenced by the point load at C and the moment)
- D: 0 kN (all forces are balanced at the right-hand support)
The SFD is linear between the applied loads. The uniformly distributed load results in a linearly changing shear force, with a constant slope.
4. Bending Moment Diagram (BMD):
The BMD shows the bending moment at each point along the beam.
- A: -1.167 kN·m
- B: -3.459 kN·m
- C: +0.563 kN·m
- D: -7.5 kN·m
The BMD is the integral of the shear force. It shows a linear change between point loads and a parabolic curve under the uniformly distributed load. The applied moment at C causes a discontinuity in the BMD.
Summary:
This diagram presents the results of a static structural analysis, calculating and visually representing the loads, reactions, shear forces, and bending moments in a simply supported beam. The SFD and BMD are crucial for understanding the internal forces within the beam and are used for design and safety assessment. The BMD is particularly important for strength design. Negative values indicate compression, and positive values indicate tension.
Additional Notes:
- The values shown are calculated results; the calculation process itself is not shown.
- This is a simplified model; it may not account for complexities present in real-world beam structures (e.g., material nonlinearity).
This explanation should provide a comprehensive understanding of the diagram. Feel free to ask if you have further questions.